Amid the accelerating artificial intelligence (AI) arms race and fresh geopolitical flare-ups, including a joint U.S.-Israeli strike on Iran that killed Ayatollah Ali Khamenei, one economic release has largely flown under the radar.
In February, the U.S. Bureau of Labor Statistics (BLS) disclosed that the economy added just 181,000 jobs in 2025, a figure significantly lower than its earlier estimate of 584,000. Moreover, the BLS also revised down 2024 job growth figures by 28%.
These revisions occur because the BLS initially releases monthly employment estimates based on surveys of businesses and households, which are later benchmarked against more comprehensive payroll tax records. When those more complete datasets come in, earlier estimates are often adjusted to reflect a more accurate picture of hiring activity, for better or worse.
The scale of the recent downward revisions has led investors to worry once again about a recession.
“Some economists note two consecutive quarters of negative gross domestic product growth as a potential indicator of a recession,” says Mark Andraos, partner and wealth advisor at Regency Wealth Management. “This, however, is not the official definition – the National Bureau of Economic Research takes into account several economic factors, including the depth and the duration of decline.”
While the most immediate impacts of an economic downturn show up in job losses and mortgage stress, the second-order effects can be just as potent. Weaker employment growth can curb discretionary consumer spending, which disproportionately affects cyclical industries such as automotive sales and apparel retail. As sales decline, companies may reduce head count and rein in capital expenditures, potentially accelerating a negative feedback loop that pressures stock valuations.
“Understanding these dynamics starts with decoding the factors that resonate with a specific economic environment,” says Matthew Bartolini, managing director and global head of research strategists at State Street Investment Management. “For a recession, these are declining economic outputs, falling demand from both consumers and businesses, increasing unemployment, and lower consumer confidence.”
Not all assets respond the same way during economic contractions. For example, some defensive equity sectors have historically held up better than the broader market, while high-quality government bonds and certain commodities such as gold may provide ballast.
“During a recession, noncyclical sectors like consumer staples, utilities and health care perform well, as their business ties to non-discretionary spending are less sensitive to economic fluctuations,” Bartolini explains. “In contrast, real estate and technology are among the worst-performing sectors during a recession, as they tend to be the first to experience spending cuts.”
The common thread for these is accessibility through exchange-traded funds (ETFs), which allow investors to efficiently tilt portfolios toward more resilient exposures.
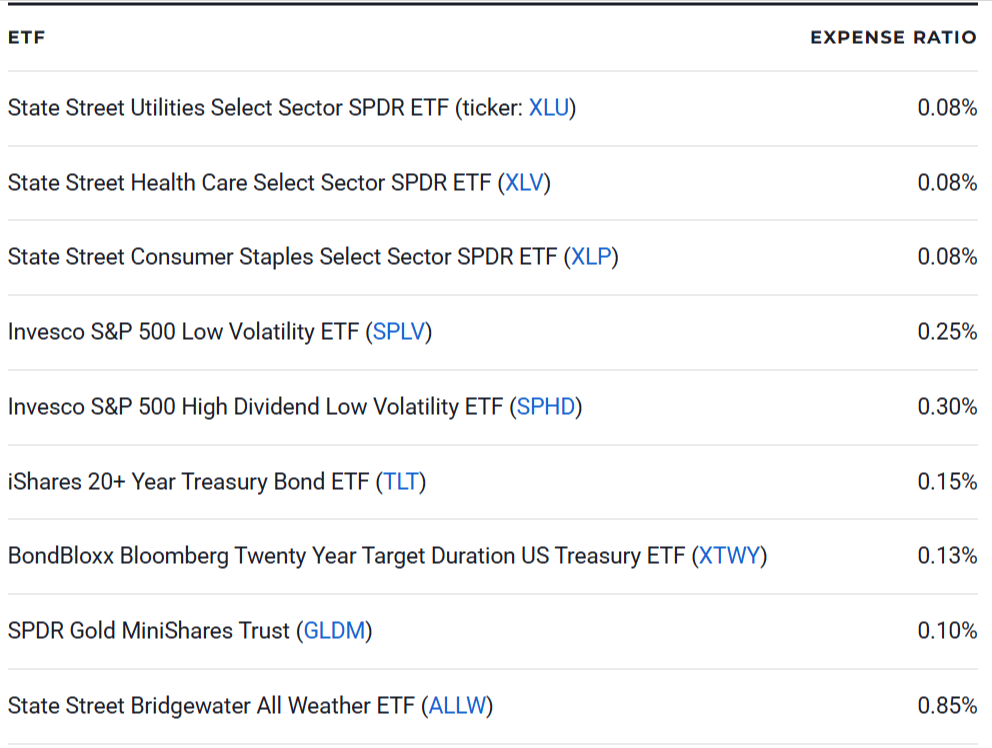
Here’s a look at nine defensive ETFs that could outperform during a recession:
ETF
State Street Utilities Select Sector SPDR ETF (ticker: XLU)
State Street Health Care Select Sector SPDR ETF (XLV)
State Street Consumer Staples Select Sector SPDR ETF (XLP)
Invesco S&P 500 Low Volatility ETF (SPLV)
Invesco S&P 500 High Dividend Low Volatility ETF (SPHD)
iShares 20+ Year Treasury Bond ETF (TLT)
BondBloxx Bloomberg Twenty Year Target Duration US Treasury ETF (XTWY)
SPDR Gold MiniShares Trust (GLDM)
State Street Bridgewater All Weather ETF (ALLW)
State Street Utilities Select Sector SPDR ETF (XLU)
“Utilities are considered defensive stocks because they operate in regulated markets, exhibit low price volatility and their services are essential, making them less vulnerable to economic downturns,” says Michael Ashley Schulman, partner and chief investment officer at Running Point Capital Advisors. For households facing financial pressure, the water and electricity bills are among the first to be paid.
XLU provides exposure to 30 utility stocks selected from the S&P 500 index. This tilts the ETF’s portfolio toward larger and more liquid utility companies with a consistent earnings history. XLU is also less sensitive than the broad market, with a five-year equity beta of 0.8. The ETF charges a 0.08% expense ratio, and it currently has an above-average 30-day SEC yield of 2.5% with quarterly payouts.
State Street Health Care Select Sector SPDR ETF (XLV)
“Many health care companies offer essential goods and services, from pharmaceuticals to medical devices, which are non-discretionary expenses for consumers,” Schulman explains. “The aging population in the U.S. (and most other developed countries) also contributes to sustained demand.” Investors can capture a broad swathe of the U.S. health care sector via XLV.
As with XLU, XLV draws from the S&P 500 index, which ensures a baseline for earnings quality, liquidity and market capitalization. The 60 companies in this ETF include pharmaceutical and biotechnology firms, medical device manufacturers, health care service providers, health care insurance companies, and life science and laboratory technology companies. XLV also charges a 0.08% expense ratio.
State Street Consumer Staples Select Sector SPDR ETF (XLP)
“Consumer staples stocks tend to hold up better than cyclical or growth-dependent businesses during recessions because these companies sell products that people need regardless of the economic climate – think toilet paper, toothpaste, food and basic household items,” Schulman says. In a downturn, households typically cut activities like movies or dining out before trimming pantry staples or toiletries.
Investors can access 36 of the largest U.S.-listed consumer staples companies through XLP. The largest allocation in the portfolio is consumer staples retail, including major big-box supermarkets, followed by beverage manufacturers, beverage distribution, household products, packaged food producers and tobacco. XLP also charges a 0.08% expense ratio and currently pays a 2.4% 30-day SEC yield.
Invesco S&P 500 Low Volatility ETF (SPLV)
“SPLV owns the 100 stocks in the S&P 500 with the lowest one-year trailing volatility,” says Nick Kalivas, head of factor and core equity ETF product strategy at Invesco. “Stocks are weighted by the inverse of volatility, so the stocks with the lowest volatility receive the highest weight.” Over the trailing five-year period SPLV has recorded a beta of just 0.5, around half that of the S&P 500 index.
SPLV’s current portfolio is strongly tilted toward the utility sector, at roughly a quarter of its holdings. However, investors shouldn’t expect this ETF’s portfolio to remain static. Every quarter, SPLV reconstitutes and rebalances to select new stocks and ensure the lowest-volatility stocks get the largest allocation. The ETF charges a 0.25% expense ratio and pays a 2.2% 30-day SEC yield.
Invesco S&P 500 High Dividend Low Volatility ETF (SPHD)
“SPHD selects the 50 stocks in the S&P 500 with the highest yield and lowest one-year trailing volatility,” Kalivas explains. “Stocks are weighted by dividend yield, and the holdings are subject to the constraint of no more than 10 names per sector, a sector cap of 25% and single-stock cap of 3%.” This ETF is slightly more volatile than SPLV, with a five-year beta of 0.7, but it remains less volatile than the broad market.
Compared to SPLV, SPHD is more suitable for income-oriented investors, with a higher 4.4% 30-day SEC yield, in addition to a monthly payout cadence. However, its portfolio is more concentrated, with 50 instead of 100 holdings, and it has higher cyclical sector exposure, particularly when it comes to real estate, energy and communications. SPHD is also slightly pricier, with a 0.3% expense ratio.
iShares 20+ Year Treasury Bond ETF (TLT)
“Typically, during a recession, the Federal Reserve looks to cut interest rates to stimulate economic growth, as low interest rates encourage borrowing,” Andraos says. “In a falling-interest-rate environment, longer-duration bonds tend to outperform, as yields and bond prices are inversely related.” This dynamic is why some investors use long-term Treasury bond ETFs like TLT to hedge a portfolio.
This ETF tracks the ICE US Treasury 20+ Year Bond Index and has an average duration of 15.7 years. All else being equal, a one-percentage-point cut in rates could see TLT’s net asset value rally by 15.7%. However, a rising interest rate environment can cause severe losses for TLT, as evidenced in 2022 when the ETF fell 31.4%. TLT charges a 0.15% expense ratio and pays a 4.6% 30-day SEC yield.
BondBloxx Bloomberg Twenty Year Target Duration US Treasury ETF (XTWY)
“Investors anticipating an economic slowdown or recession should consider lengthening the duration of their portfolios with long-dated U.S. Treasurys,” explains JoAnne Bianco, partner and senior investment strategist at BondBloxx. “Our longest-duration bond ETF, XTWY, would likely benefit the most in performance during a broad economic downturn.” This ETF undercuts TLT with a 0.125% expense ratio.
XTWY’s benchmark is the Bloomberg US Treasury Twenty Year Duration Index. Compared to TLT, this ETF has an even higher duration of 19.9 years, which amplifies interest-rate sensitivity. However, credit risk remains minimal given the holdings are U.S. federal government-backed debt. Income potential for XTWY is also slightly higher than TLT, with the ETF currently paying a 4.7% 30-day SEC yield.
SPDR Gold MiniShares Trust (GLDM)
During a typical recession, slowing growth and easing inflation pressures can lead central banks to cut interest rates, which often benefits bond prices. One key exception is stagflation, a rare environment where economic growth slows while inflation remains elevated. In that scenario, long-duration treasury ETFs such as TLT and XTWY can face significant headwinds as rising bond yields pressure prices.
Gold has historically been viewed as a more resilient hedge in inflationary downturns. Unlike fiat currencies, gold cannot be printed or debased, its supply is finite and it continues to be accumulated by central banks as a reserve asset. A convenient and cost-effective way to gain exposure is through GLDM, which charges a 0.1% expense ratio. The ETF is very liquid, with a 0.01% 30-day median bid-ask spread.
State Street Bridgewater All Weather ETF (ALLW)
Some ETFs are designed not to predict the next macro regime but to endure across all of them, whether the backdrop is high growth, recession, inflation or deflation. The most well-known blueprint for this approach is the “all weather” strategy, developed by hedge fund Bridgewater Associates under founder and former CEO Ray Dalio. That framework is now accessible in ETF form through ALLW.
Currently, ALLW’s exposures are roughly 68% global bonds, 42% global equities, 40% inflation-linked bonds and 34% commodities. These figures add up to more than 100% because the portfolio uses leverage to scale positions after equalizing each asset class’s contribution to overall volatility, a strategy called risk parity. However, ALLW’s sophistication comes at a relatively high 0.85% expense ratio.